
Now that we've updated the processor workflow and have a new simulator to run its results, I thought the first thing I would try is to see how a "Close Below" (or CB) can give us an early warning to exit a trade. A close below is when a candle on the same timeframe as your hold level closes inside the hold, or in other words, at a fib level lower than 1.0.
I first tried it with the Low Risk Holds signals from the usual testing window (2022-01-01 to 2024-06-30), defining entries at fib 1.0 and exiting on either the 1.618 (TP), the -1 (SL), or at the exact moment any candle from that same timeframe closes below fib 1, and the results were about a 9% drop in win rate for a significantly higher bankroll. I suppose it makes sense that we're cutting losses much earlier - on every instance that doesn't blow right through the fib -1 in just one candle, in exchange for taking a small hit on a few would-be winners. Seems like a good trade-off.
One of the problems of BUPSSBot1 and its Low Risk Holds (LRH) strategy, however, is volume. It doesn't find enough work. So can our new simple strat save Medium Risk Holds (MRH)? (see our explainer post of low/medium/high risk holds on our discord, here)
First test: all MRHs on just the LTF & MTF (2m to 12h) of at least 1% move size; take positions for 50% of bankroll; max leverage 1.8x per side (so effectively a limit of 3 positions at a time).
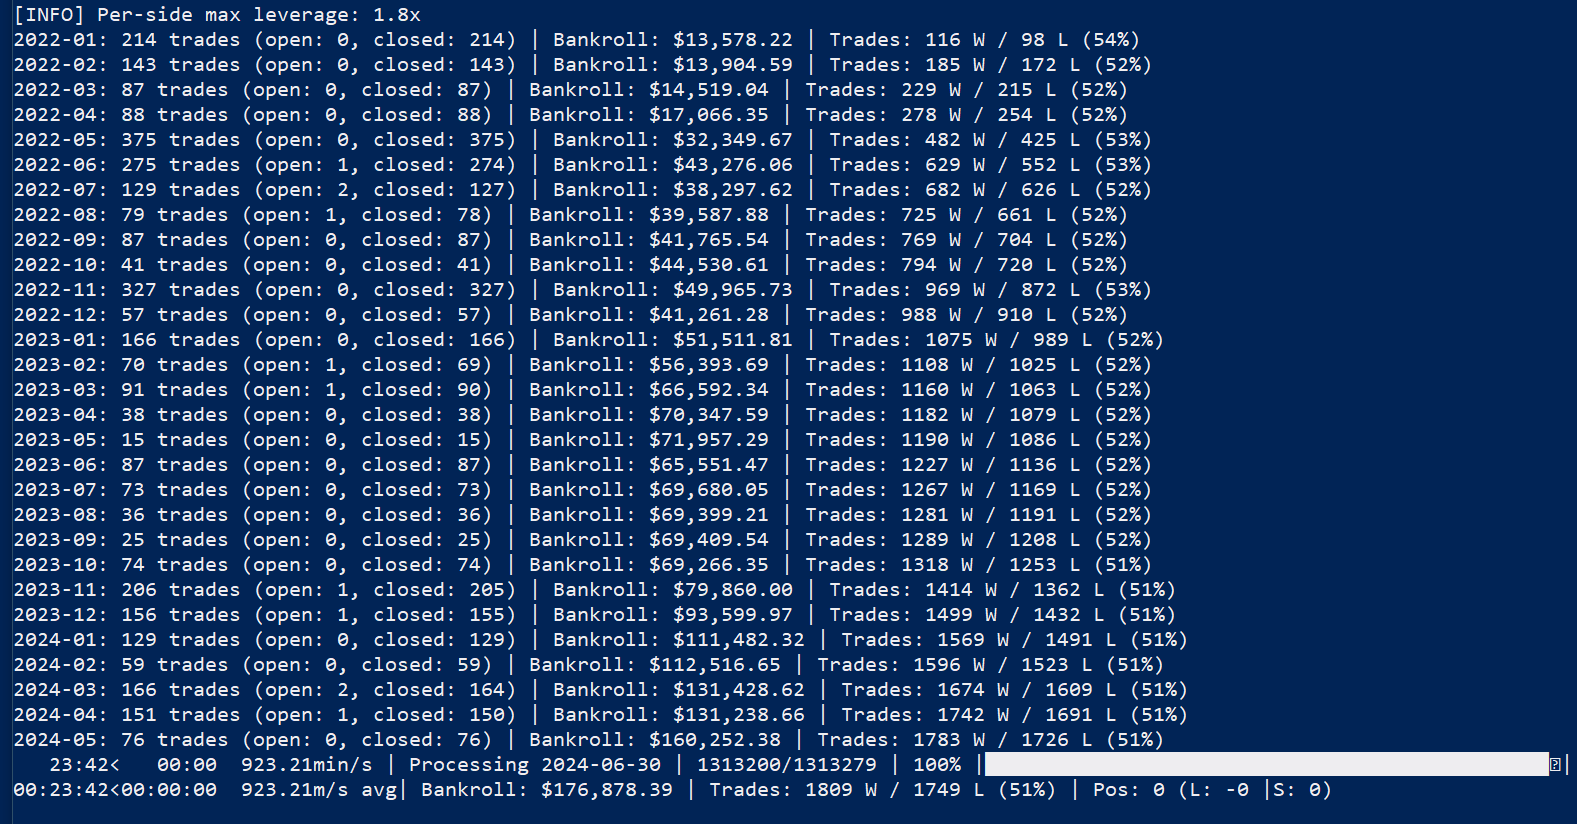
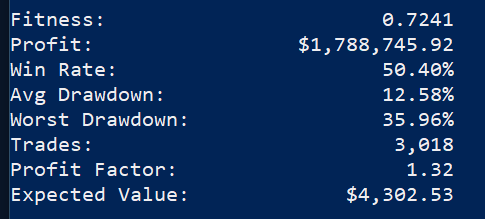
Well that turned out to be effective. How does that compare to the best sims our LRH bot could do? Top sim by total profit on the left, top sim by fitness in the middle, and our new sim on the right.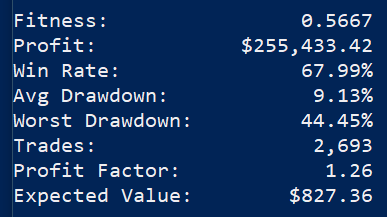
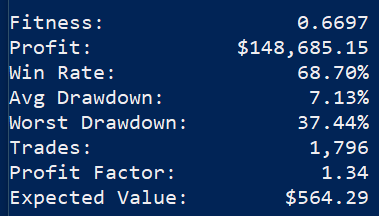
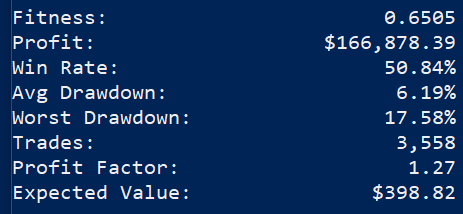
We're in the same wheelhouse now as those previous sims, using only 50% bankroll position sizes with 1.8x max leverage (effectively 3 positions max per side). The previous sims used 125% position sizes with no cap on positions or leverage. Because of the lower sizes, the worst drawdown is less than half.
I ran one at 125% with max leverage 3x (2 positions per side) just for fun and got this:
Since this strat was so effective, I started to think maybe I should be testing entering counter trades on a close below in addition to just exiting the original trade, and this is how CTs got added to the simulator. But where do we put a target and a SL on this kind of entry?
I first tried experimenting with a 1:1 RR and realized pretty quickly that I had built a Dirk-Bot - it kept hedging bad positions, putting TPs and SLs in the same neighborhood, creating no-win situations. We're not catching refined entries here, so we need a little room to breathe on the SL side. I then tried bucketing our CB instances by the fib level where they experienced their close below, with buckets 0.1 fibs wide, and checking to see if they would go down 0.9 fibs from their bucket (TP) vs 3.5 fibs up from their bucket (SL). This also proved to be fairly effective. Here's the same 50% units sim from above, with CT trades added. The close below needs to happen somewhere between fib 1 and fib -1.5 (I didn't bucket them any lower).
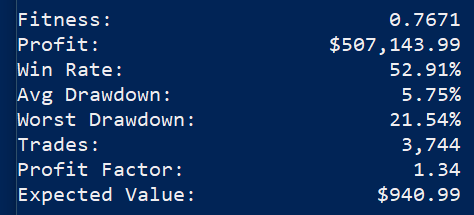
Worst drawdown got a little bit worse, but everything else got better, including average drawdown, which is interesting. It's not hard to see why - the LRH and MRH trades make me feel like I designed a knife-catcher bot; CT trades are the opposite; they're very "go with the flow".
After this I switched from % of bankroll to a flat $1K position size trades because I realized I was introducing recency bias into the results - if we want to learn how well a strategy does (and not what it is capable of with compounding), we can't allow a late loss (when the bankroll is big) to affect our perceptions on things like per timeframe results, otherwise we might think one timeframe sucks at the strategy when it really doesn't. The flat position size sims all seemed to suggest timeframe doesn't matter, they're all about the same, which is about what you'd expect.
Claude and I did hone in on other parameters, without trying to be too overfitting like the LRH strategy felt like in retrospect, and we settled in at move sizes at least 0.5%; CTs that close between fib 0.5 and fib -1.5 (again, didn't check any lower, but shallow CBs generally weren't worth CT trading). I even asked Claude multiple times if there might be a better point below fib 1.0 to exit with a close below, but there didn't seem to be an optimal level below it to work with.
So at this point I rush to build our new BUPSSBot2 and get it hooked into a Discord channel, practically mentally buying my ticket to Bora Bora, when the voices of reason in this community tell me it's time to test this strategy on other assets, in even bigger testing periods. So after getting a hold of scads of BTC and ETH 1s data, I ran some more sims, hoping to take a victory lap. The results were alarming, but not in the way I was expecting.
The following data comes from sims I ran on BTC and ETH (8.5 years) and SOL (5.5 years), all ending on 2026-03-30.
They use the filters that Claude suggested above, with $1K fixed position sizes on direct trades and half of that on CT trades.
Also, just for reference, a $1K position size means trying to make $5 on a 0.5% move, so keep that in mind when you see these numbers.
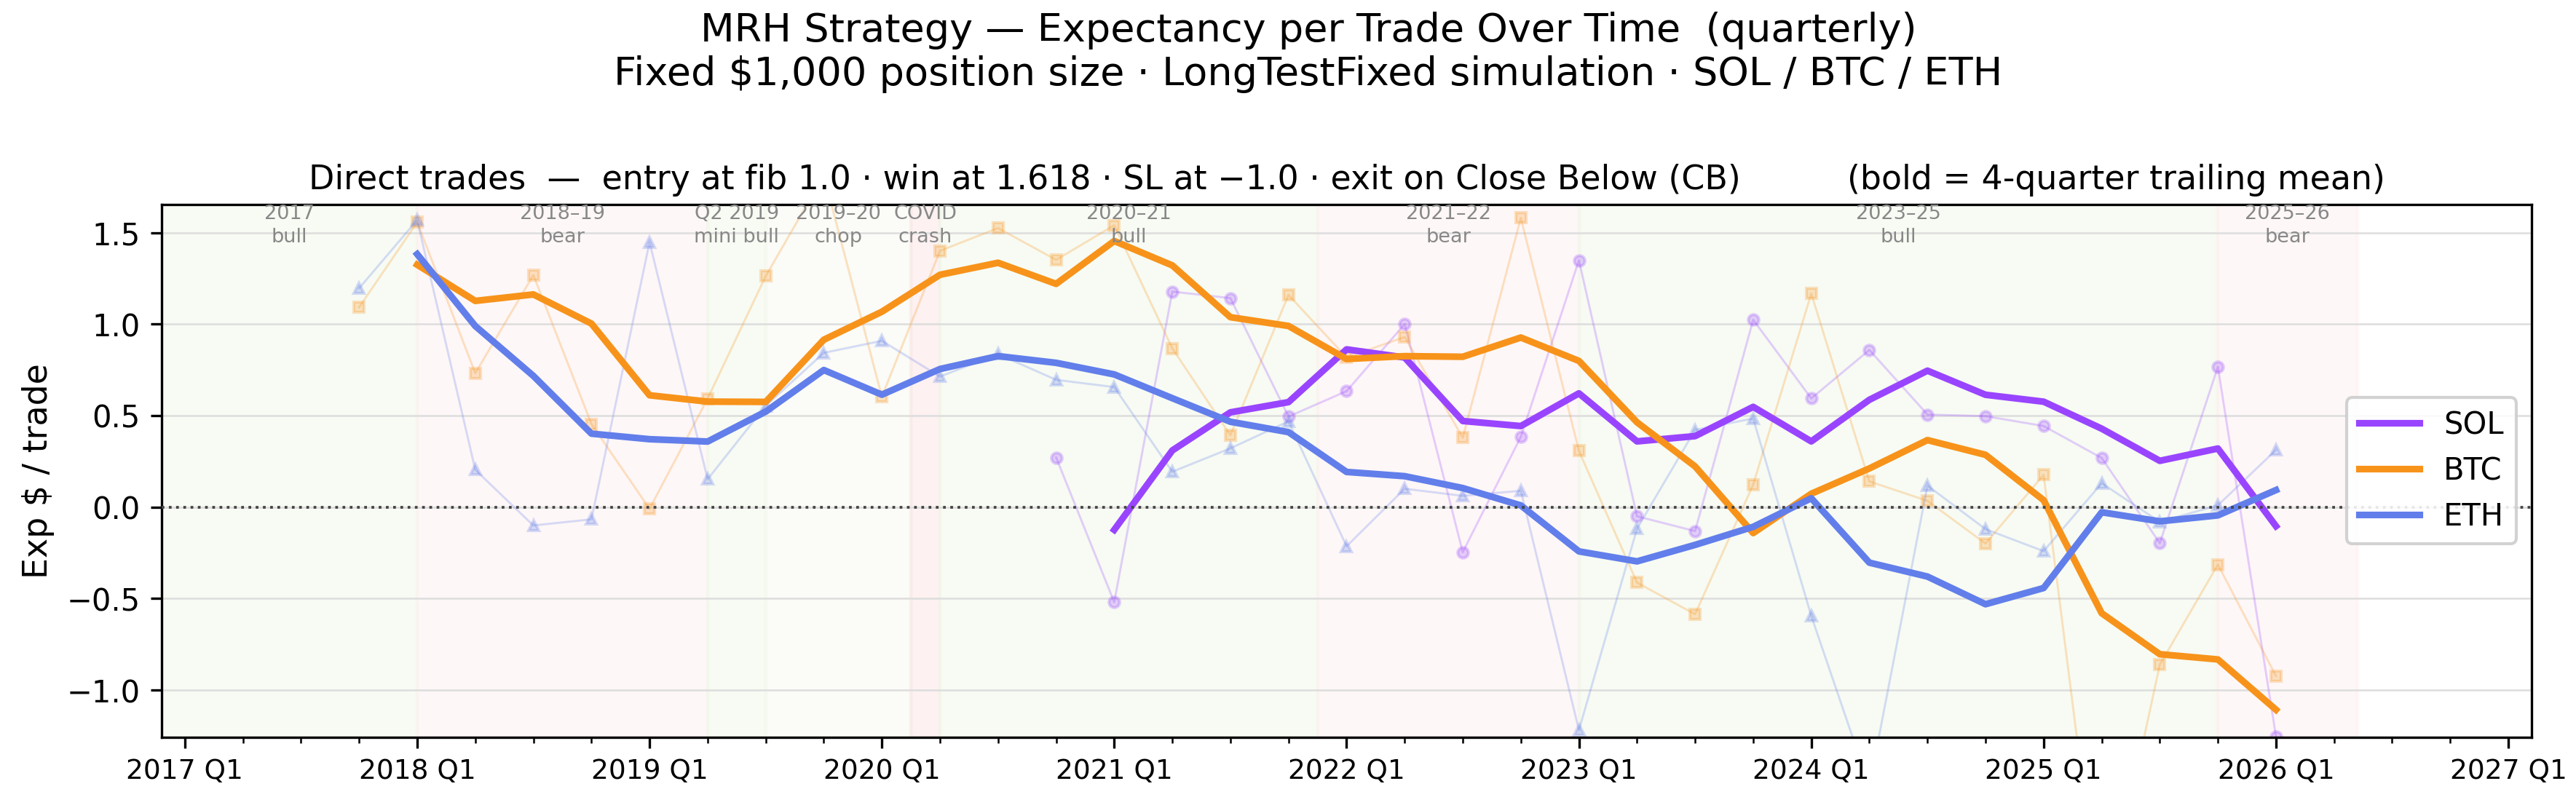
Oh no! It looks like I had been testing SOL over its best possible period for the strategy. It had a pretty big edge in the past, but in recent years, it seems to have eroded away on BTC and ETH, and perhaps SOL, too. This is direct trades, what about CTs?
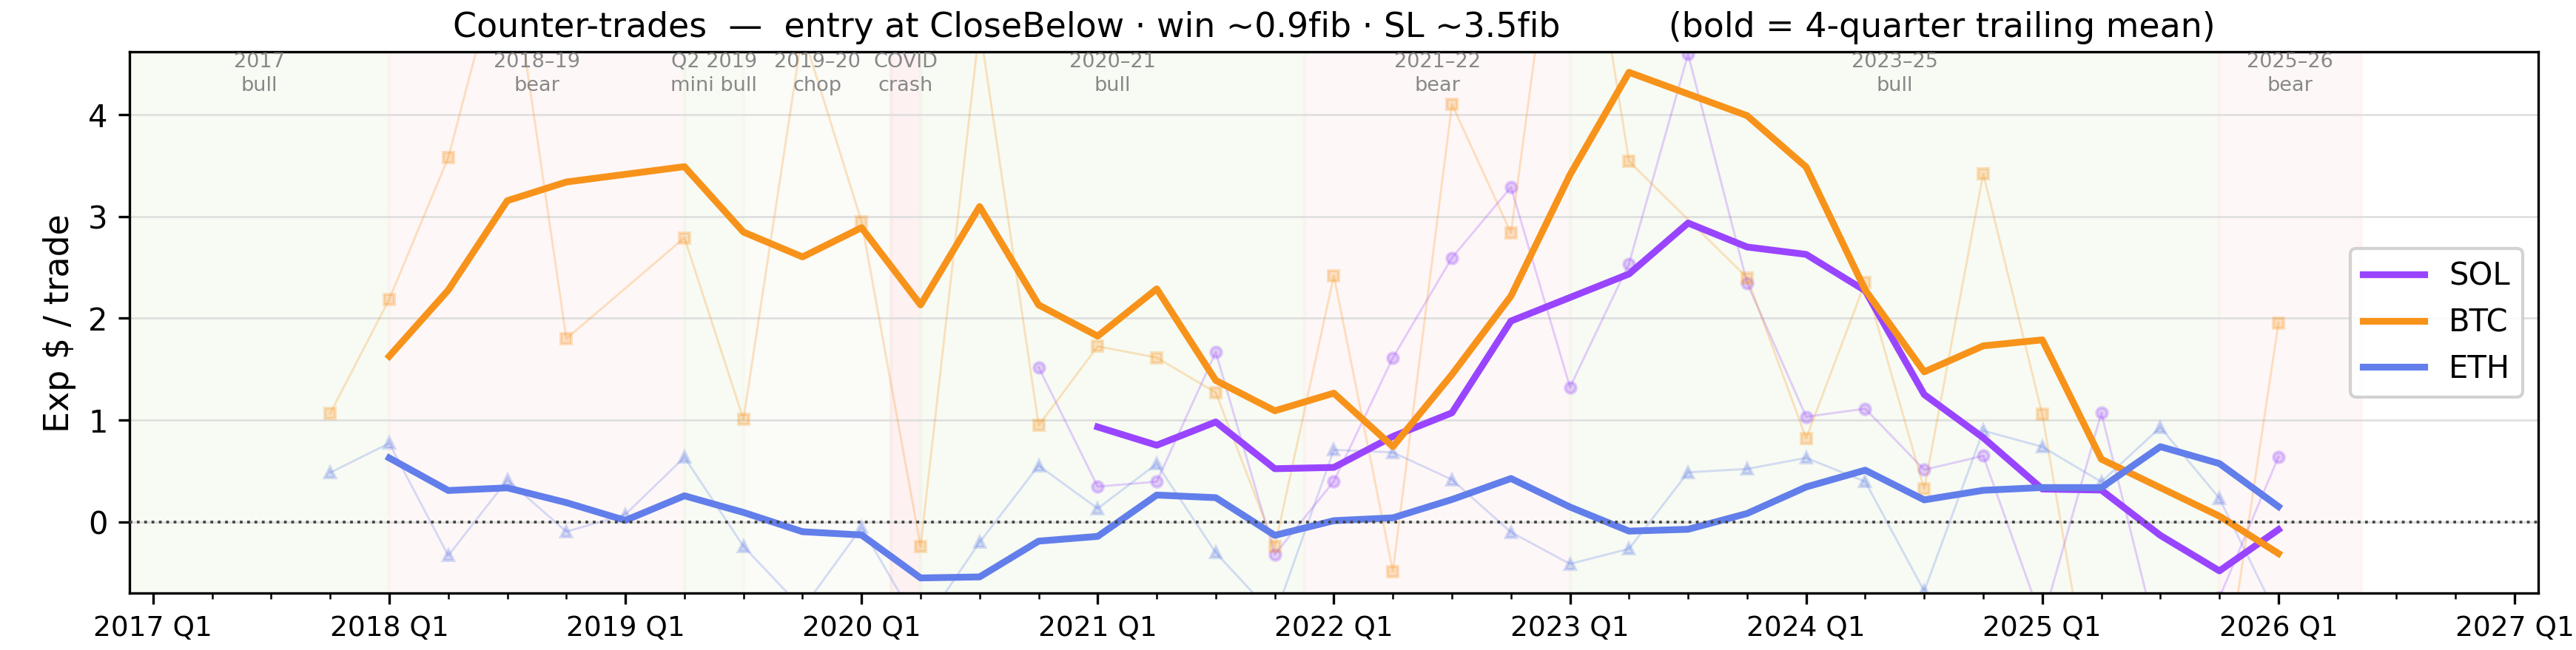
I'm less sure what to make of these ones; it might be a little boom&bust-like; it might just be that it does well in bear markets and poorly in bull markets? Either way it appears to be in trouble at the moment on all 3 assets.
Are we seeing more severe close below levels over the years?

Not really, the average close fib level seems to be pretty stable, and the strategy was plenty healthy at some of the lower spots on this chart.
What about the number of instances that become close belows... are they increasing?

Well, this is concerning. The number of holds getting closed into has been rising for a long time now, from a mid 30% in 2018 to breaking the 50% barrier for BTC. That's not going to allow our strategy to be sustainable, and is the likely reason why the BTC numbers crumbled in the graphs above. There's some hope of SOL/ETH going down from here, but who knows; the uptrend here has been very strong for a long time.
Does that mean it's time to give up on this dream? I don't think so. After having run it live for a few weeks, I've seen a lot of instances where I get a fill but only because I front-ran the hold; sometimes this means I pick up a win before the instance ever activates. Then later it does activate and gets closed below, going down as a loss by the strategy definition / backtesting engine even though it's a win in my book. This might mean testing instances for activations up into the wick somewhere. Maybe I'll start at fib 1.1 and see how it goes. Or maybe I'll go test something else. We'll see.
In closing, I'll leave you with these other graphs I made that break down the PnL of these 1K simulations into their trade outcomes.
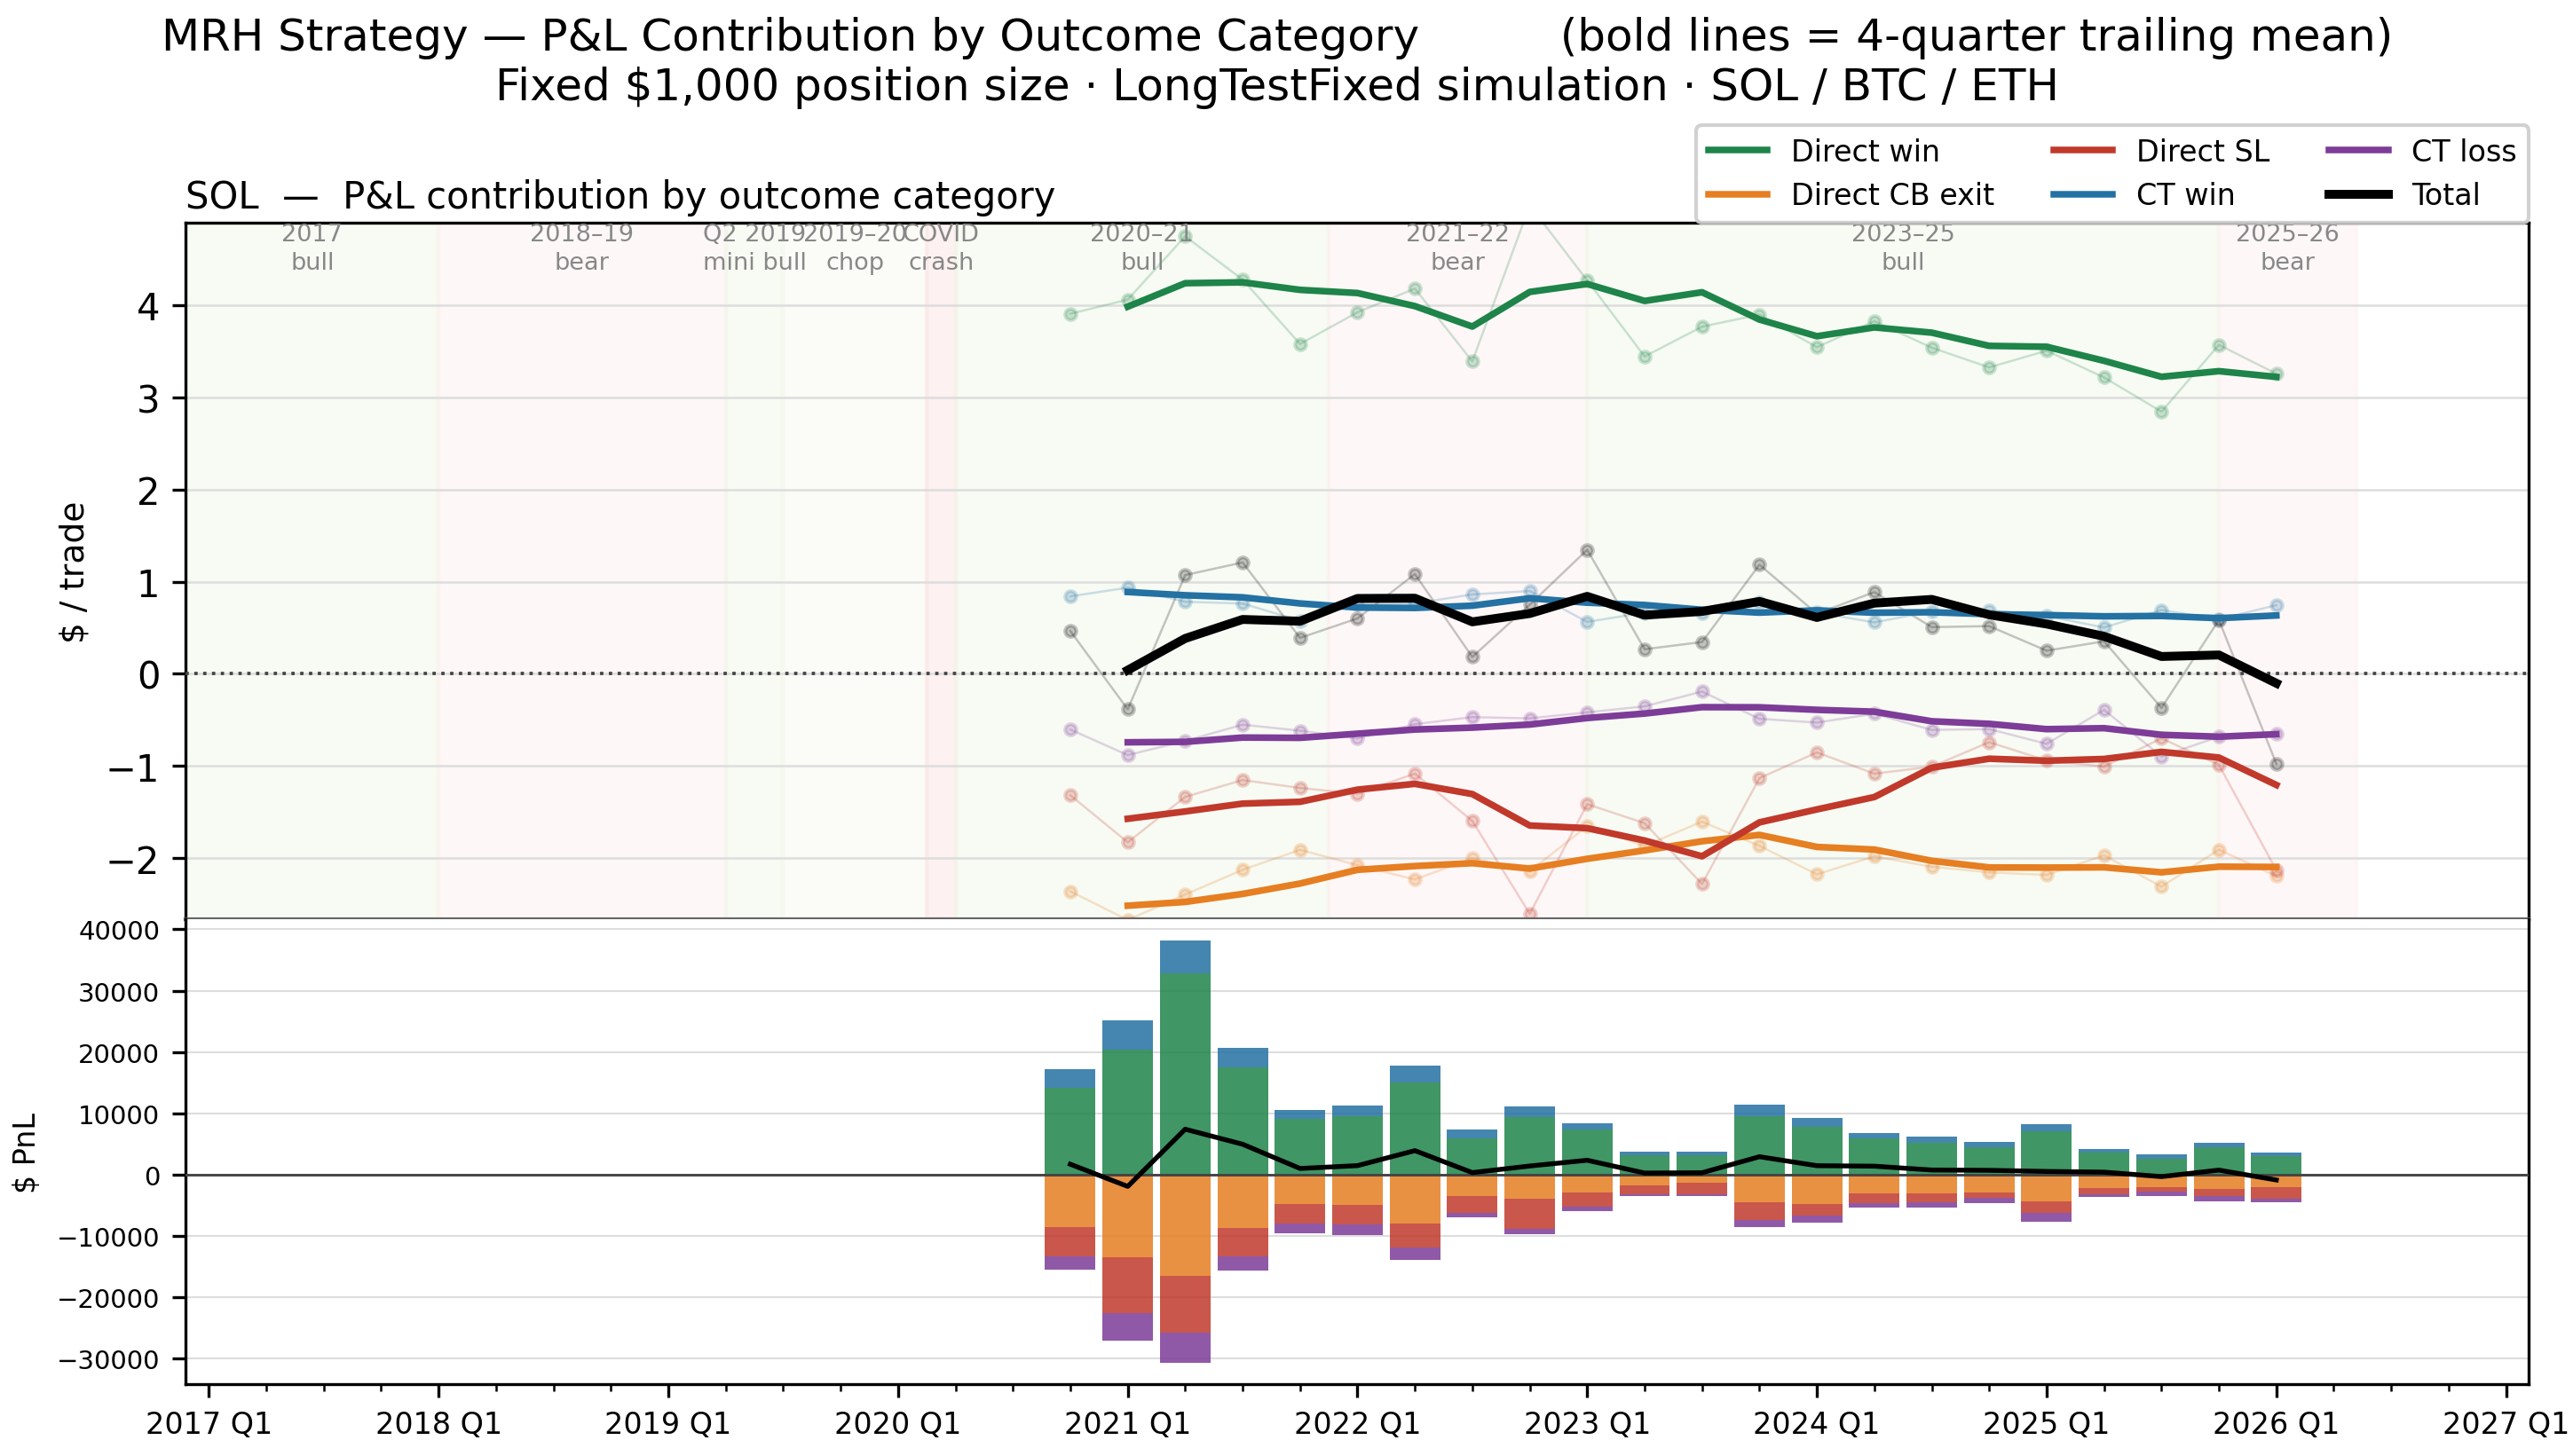
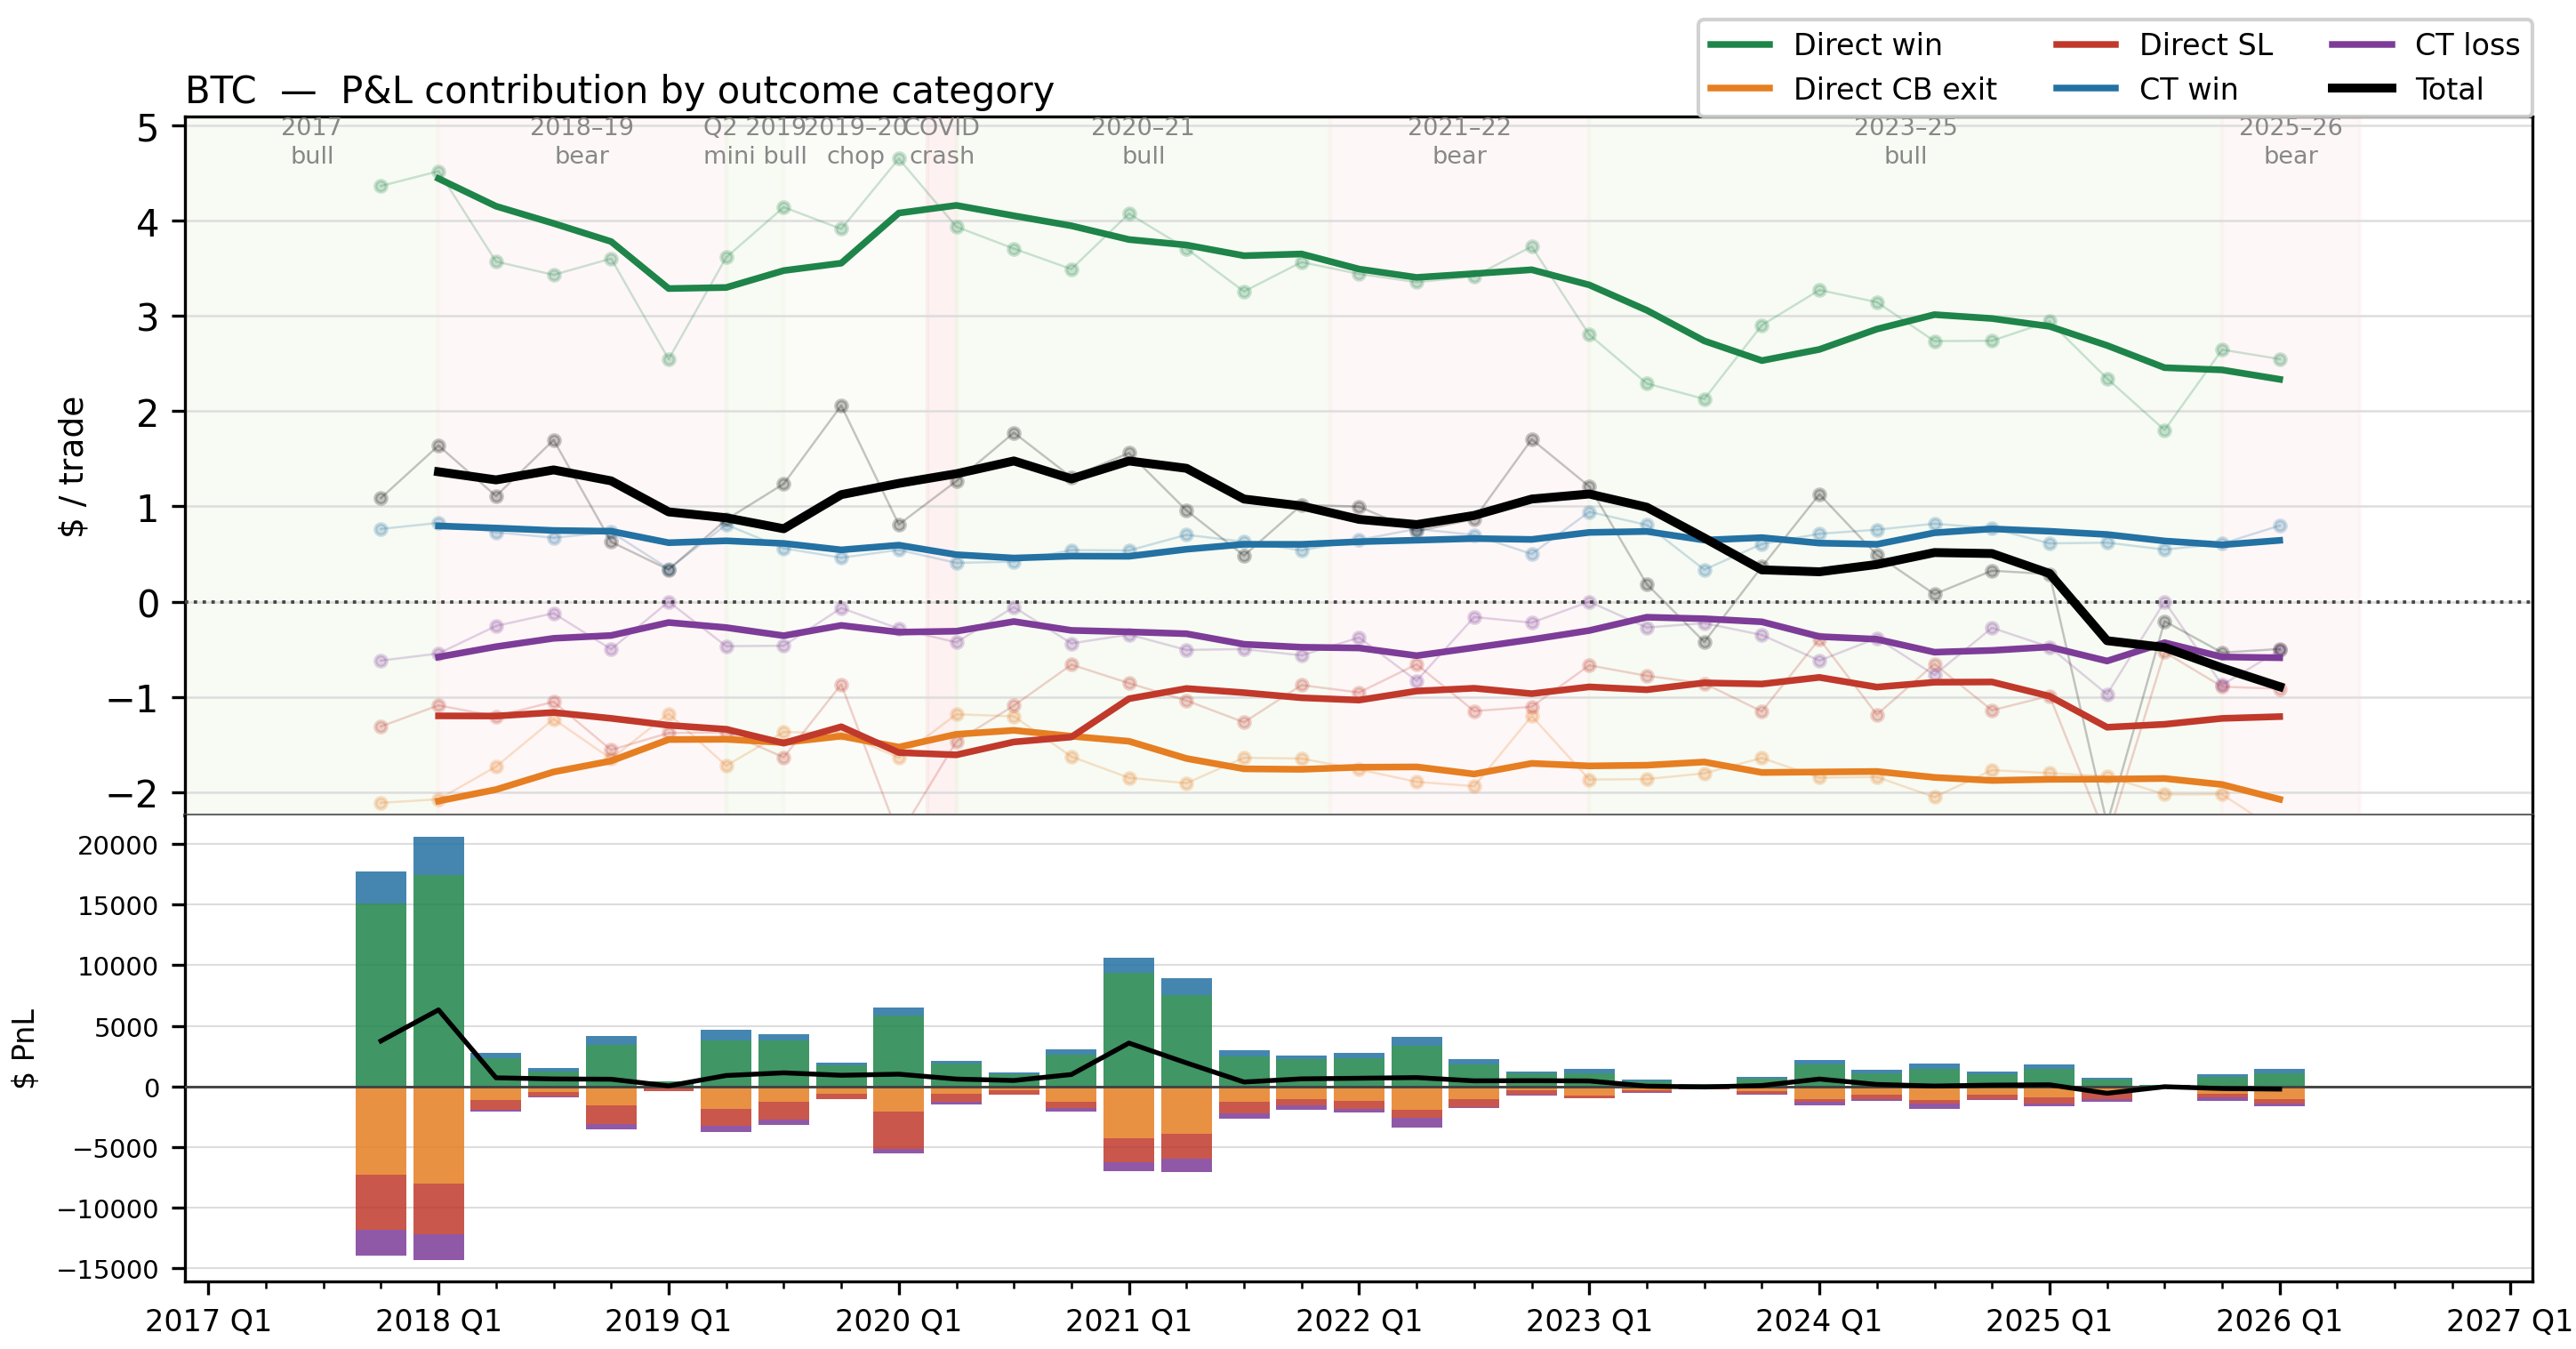
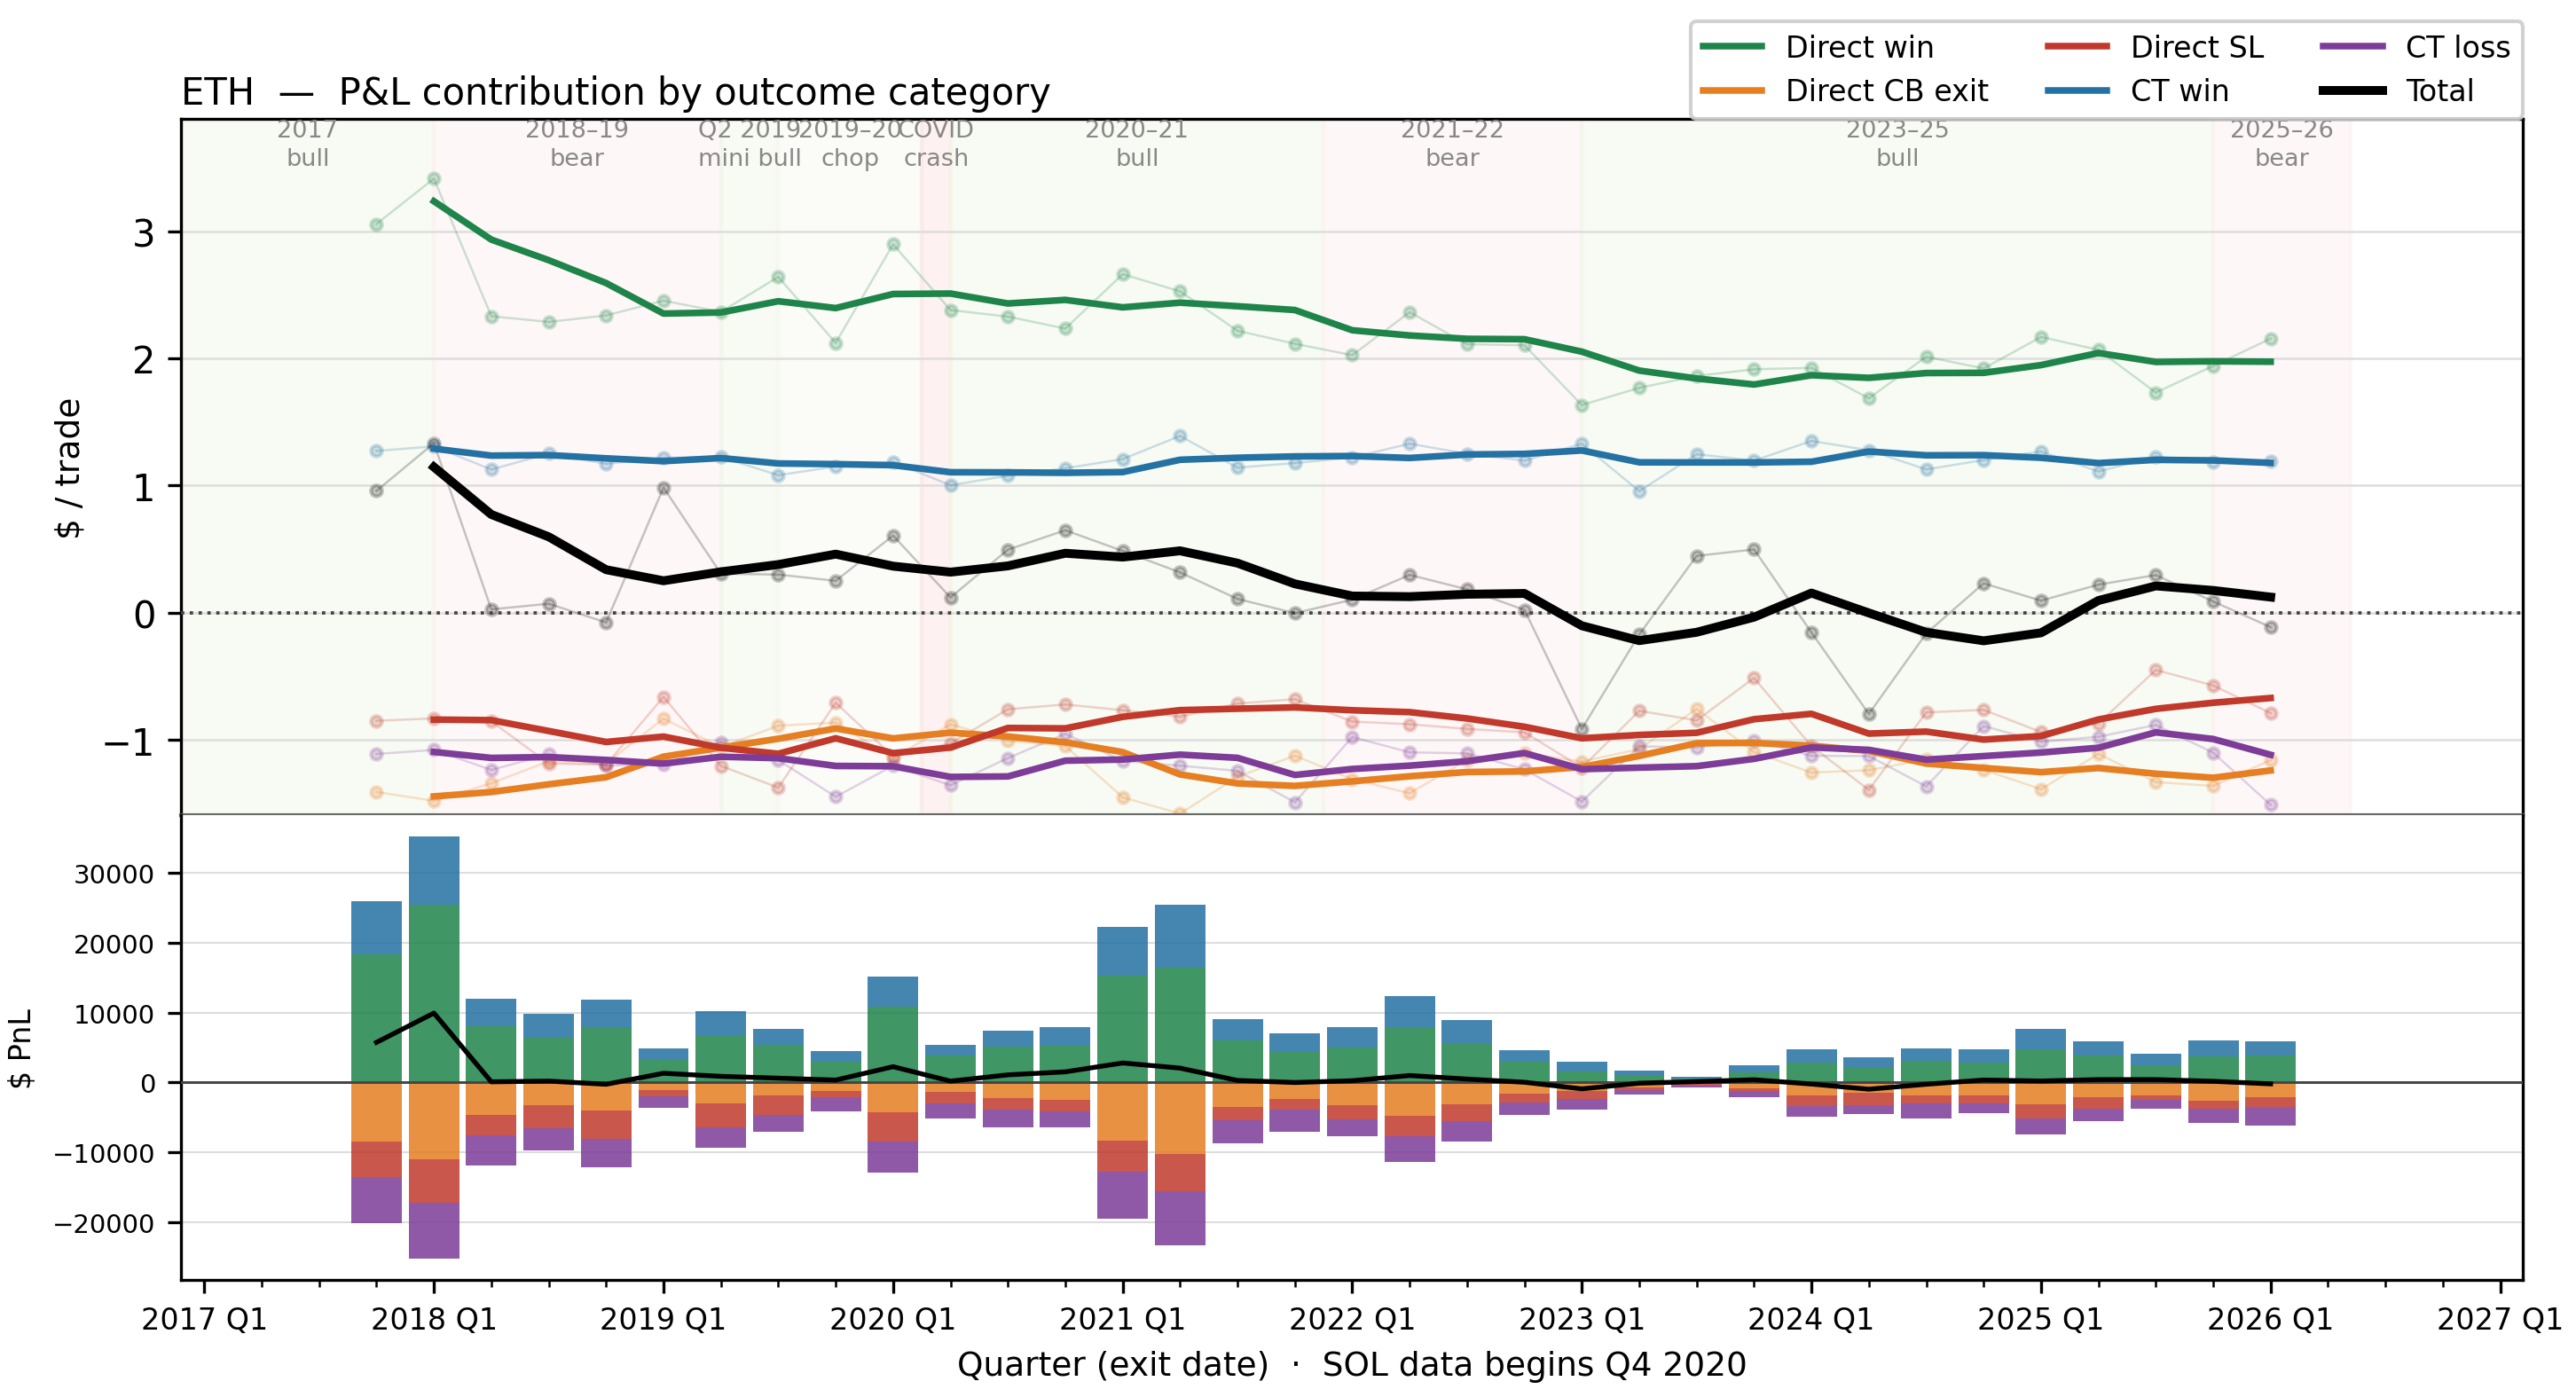
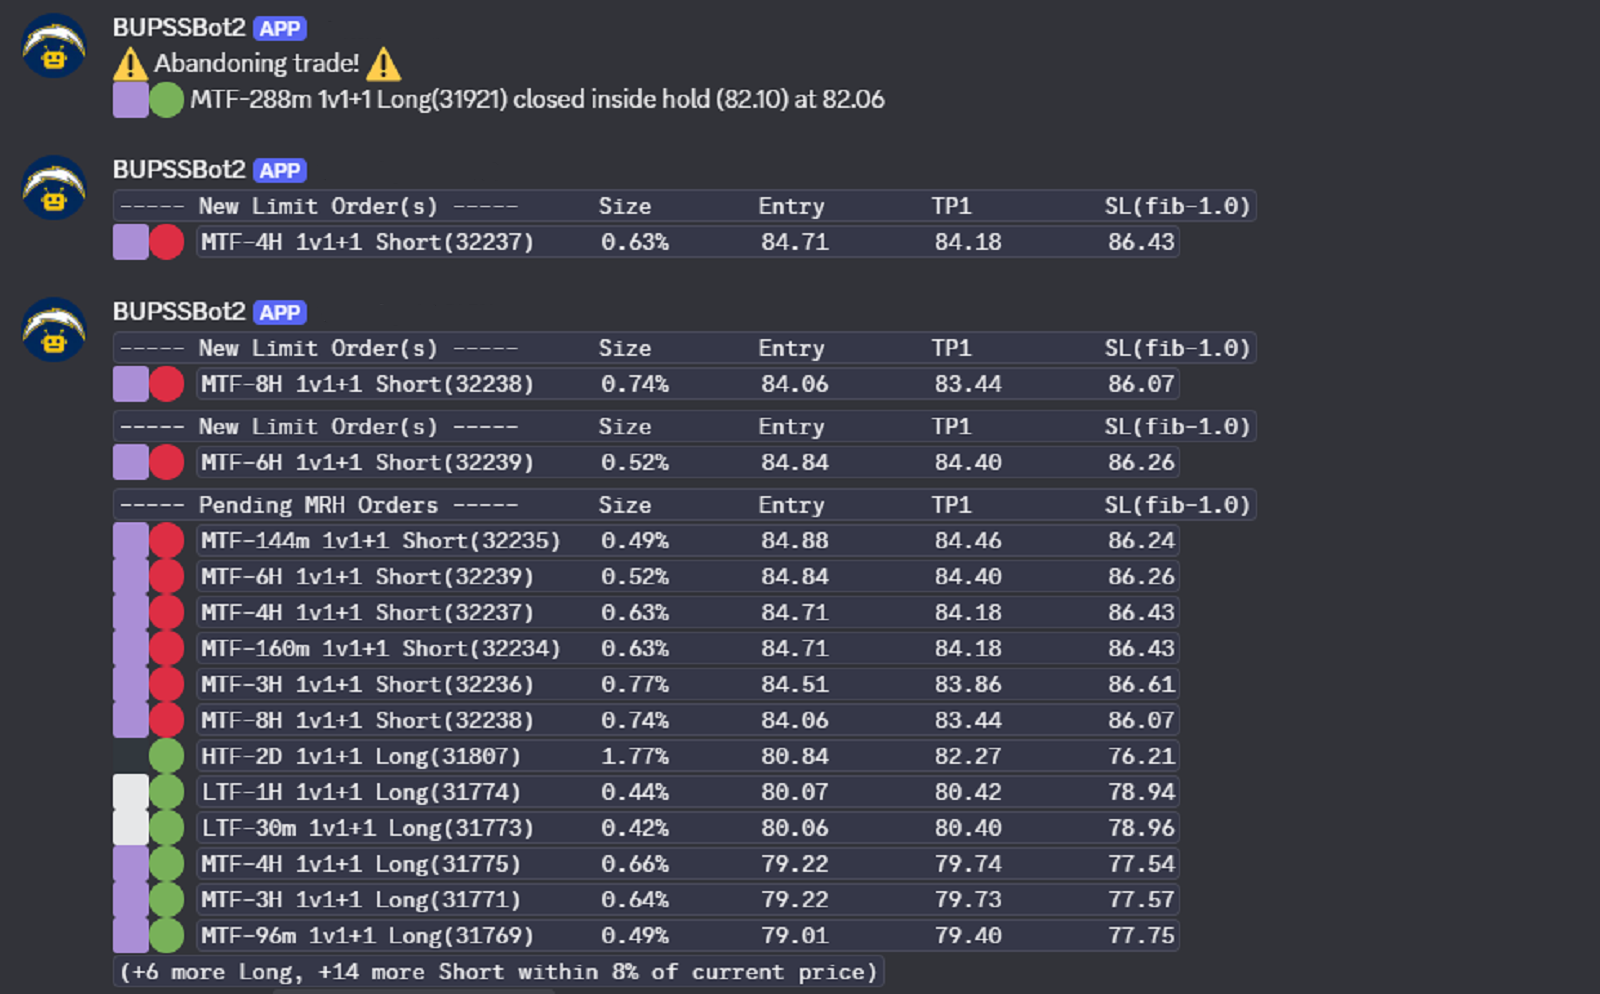
BUPSSBot 2, or the "medium-risk-and-reversehold-sol-trades" Discord channel is now available to Patreon members at the Supporter tier or higher. It will report on any new LOs it creates; any trades that would be abandoned because of a close below; and any counter-trades (reverse holds) it will enter into. It will also keep a list of the nearest pending LOs to current price in the latest message.
Questions, comments, ideas? Let's talk about it in the Discord server! Come find us at https://discord.gg/fiblab